Frequently Asked Questions
Tutorial Questions
The Build tissue-specific expression dataset tool (step one) exits with an error code.
Tip: The Build tissue-specific expression dataset tool (step one) exits with an error code.
For the HPS source files version select HPA normal tissue 23/10/2018 rather than the version from 01/04/2020.
What is the principle of an enrichment analysis?
What is the principle of an enrichment analysis?
Enrichment analysis approach (also called over-representation analysis (ORA)) was introduced to test whether pre-specified sets of proteins (e.g. those acting together in a given biological process), change in abundance more systematically than as expected by chance. This type of analysis investigates hypotheses that are more directly relevant to the biological function, and can also help highlight a process over-represented within a subset of proteins.
What is Gene Ontology (GO)?
What is Gene Ontology (GO)?
A very commonly used way of specifying these sets is to gather genes/proteins that sharethe same Gene Ontology (GO) term, as specified by the Gene Ontology Consortium.
The GO project provides an ontology that describes gene products and their relationsin three non-overlapping domains of molecular biology, namely “Molecular Function”,“Biological Process”, and “Cellular Component”. Genes/proteins are annotated by oneor several GO terms, each composed of a label, a definition and a unique identifier.GO terms are organized within a classification scheme that supports relationships, andformalized by a hierarchical structure that forms a directed acyclic graph (DAG). Insuch a graph is used the notions of child and parent, where a child inherits from oneor multiple parents, child class having a more specific annotation than parent class(e.g. “glucose metabolic process” inherits from “hexose metabolic” parent term whichitself inherits from “monosaccharide metabolic process” etc.). In this graph, each node corresponds to a GO term composed of genes/proteins sharing the same annotation, whiledirected edges between nodes represents their relation (e.g. ‘is a’, ‘part of’) andtheir roles in the hierarchy (i.e. parent and child).
General Questions
Can't find one of the tools for this tutorial?
Tip: If a Tool is Missing
To use the tools installed and available on the Galaxy server:
- At the top of the left tool panel, type in a tool name or datatype into the tool search box.
- Shorter keywords find more choices.
- Tools can also be directly browsed by category in the tool panel.
If you can’t find a tool you need for a tutorial on Galaxy, please:
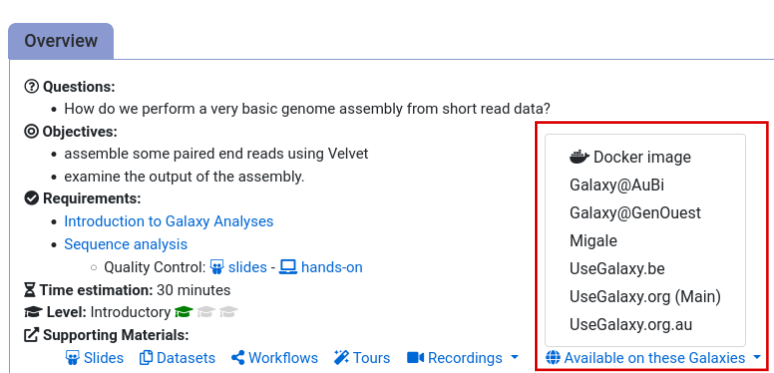
- Check that you are using a compatible Galaxy server
- Navigate to the overview box at the top of the tutorial
- Find the “Supporting Materials” section
- Check “Available on these Galaxies”
- If your server is not listed here, the tutorial is not supported on your Galaxy server
- You can create an account on one of the supporting Galaxies
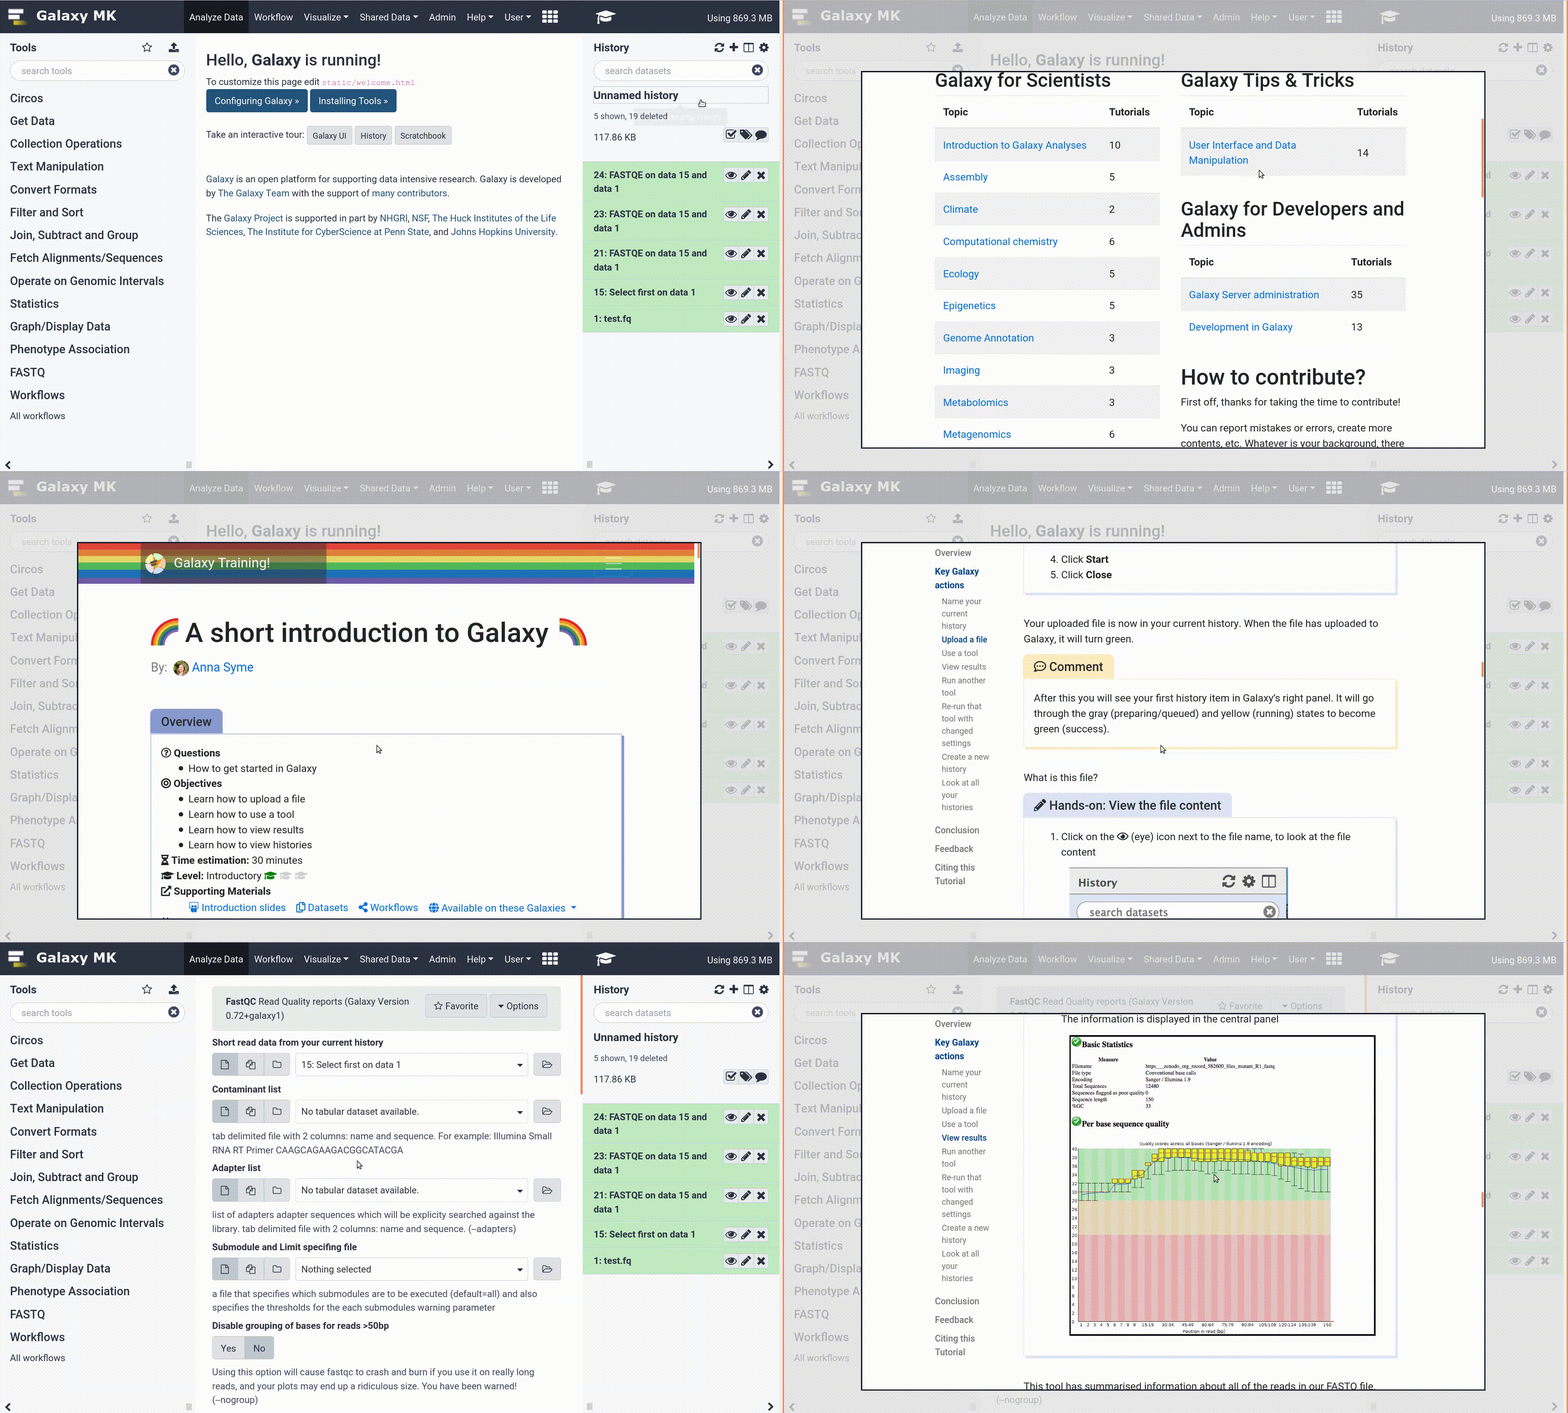
- Use the Tutorial mode feature
- Open your Galaxy server
- Click on the curriculum icon on the top menu, this will open the GTN inside Galaxy.
- Navigate to your tutorial
- Tool names in tutorials will be blue buttons that open the correct tool for you
- Note: this does not work for all tutorials (yet)
- Still not finding the tool?
- Ask help in Gitter.
Running into an error?
Tip: Troubleshooting errors
When something goes wrong in Galaxy, there are a number of things you can do to find out what it was. Error messages can help you figure out whether it was a problem with one of the settings of the tool, or with the input data, or maybe there is a bug in the tool itself and the problem should be reported. Below are the steps you can follow to troubleshoot your Galaxy errors.
- Expand the red history dataset by clicking on it.
- Sometimes you can already see an error message here
View the error message by clicking on the bug icon galaxy-bug
- Check the logs. Output (stdout) and error logs (stderr) of the tool are available:
- Expand the history item
- Click on the details icon
- Scroll down to the Job Information section to view the 2 logs:
- Tool Standard Output
- Tool Standard Error
- Submit a bug report! If you are still unsure what the problem is.
- Click on the bug icon galaxy-bug
- Write down any information you think might help solve the problem
- See this FAQ on how to write good bug reports
- Click galaxy-bug Report button
- Ask for help!
- Where?
- In the GTN Gitter Channel
- In the Galaxy Gitter Channel
- Browse the Galaxy Help Forum to see if others have encountered the same problem before (or post your question).
- When asking for help, it is useful to share a link to your history

